Turning Numbers To Narratives For Your Website

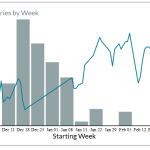
Custom Interactive Data Charts

Transform raw data into tailored charts for clearer insights and impactful decision-making, perfectly designed to meet your unique business needs

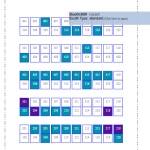
Interactive Mapping Solutions

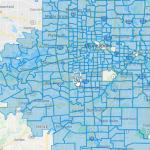
Create thoughtful, engaging and interactive maps that bring your data to life, empowering dynamic exploration and fostering curiosity.

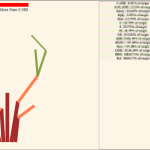
Storytelling Data Visualizations

Craft compelling, data-driven visuals that tell powerful stories, turning complex information into clear, impactful narratives that inspire your audience.

Welcome to Sassafras Consulting

Have data but don’t know where to go? Need a spark for your page? Fear not! With Lancaster our home, interactive charts, maps and graphs are our specialty. We make pages customers bookmark! We work alongside clients from concept through to publishing. Stand out with modern look and feel while users engage with live content.
Interactive Charts, Maps And Graphs For Your Webpage

Get In Touch With Us

Discover insights and unlock your data’s potential!